S&P500 Daily Action Areas & Price Targets 16/9/26

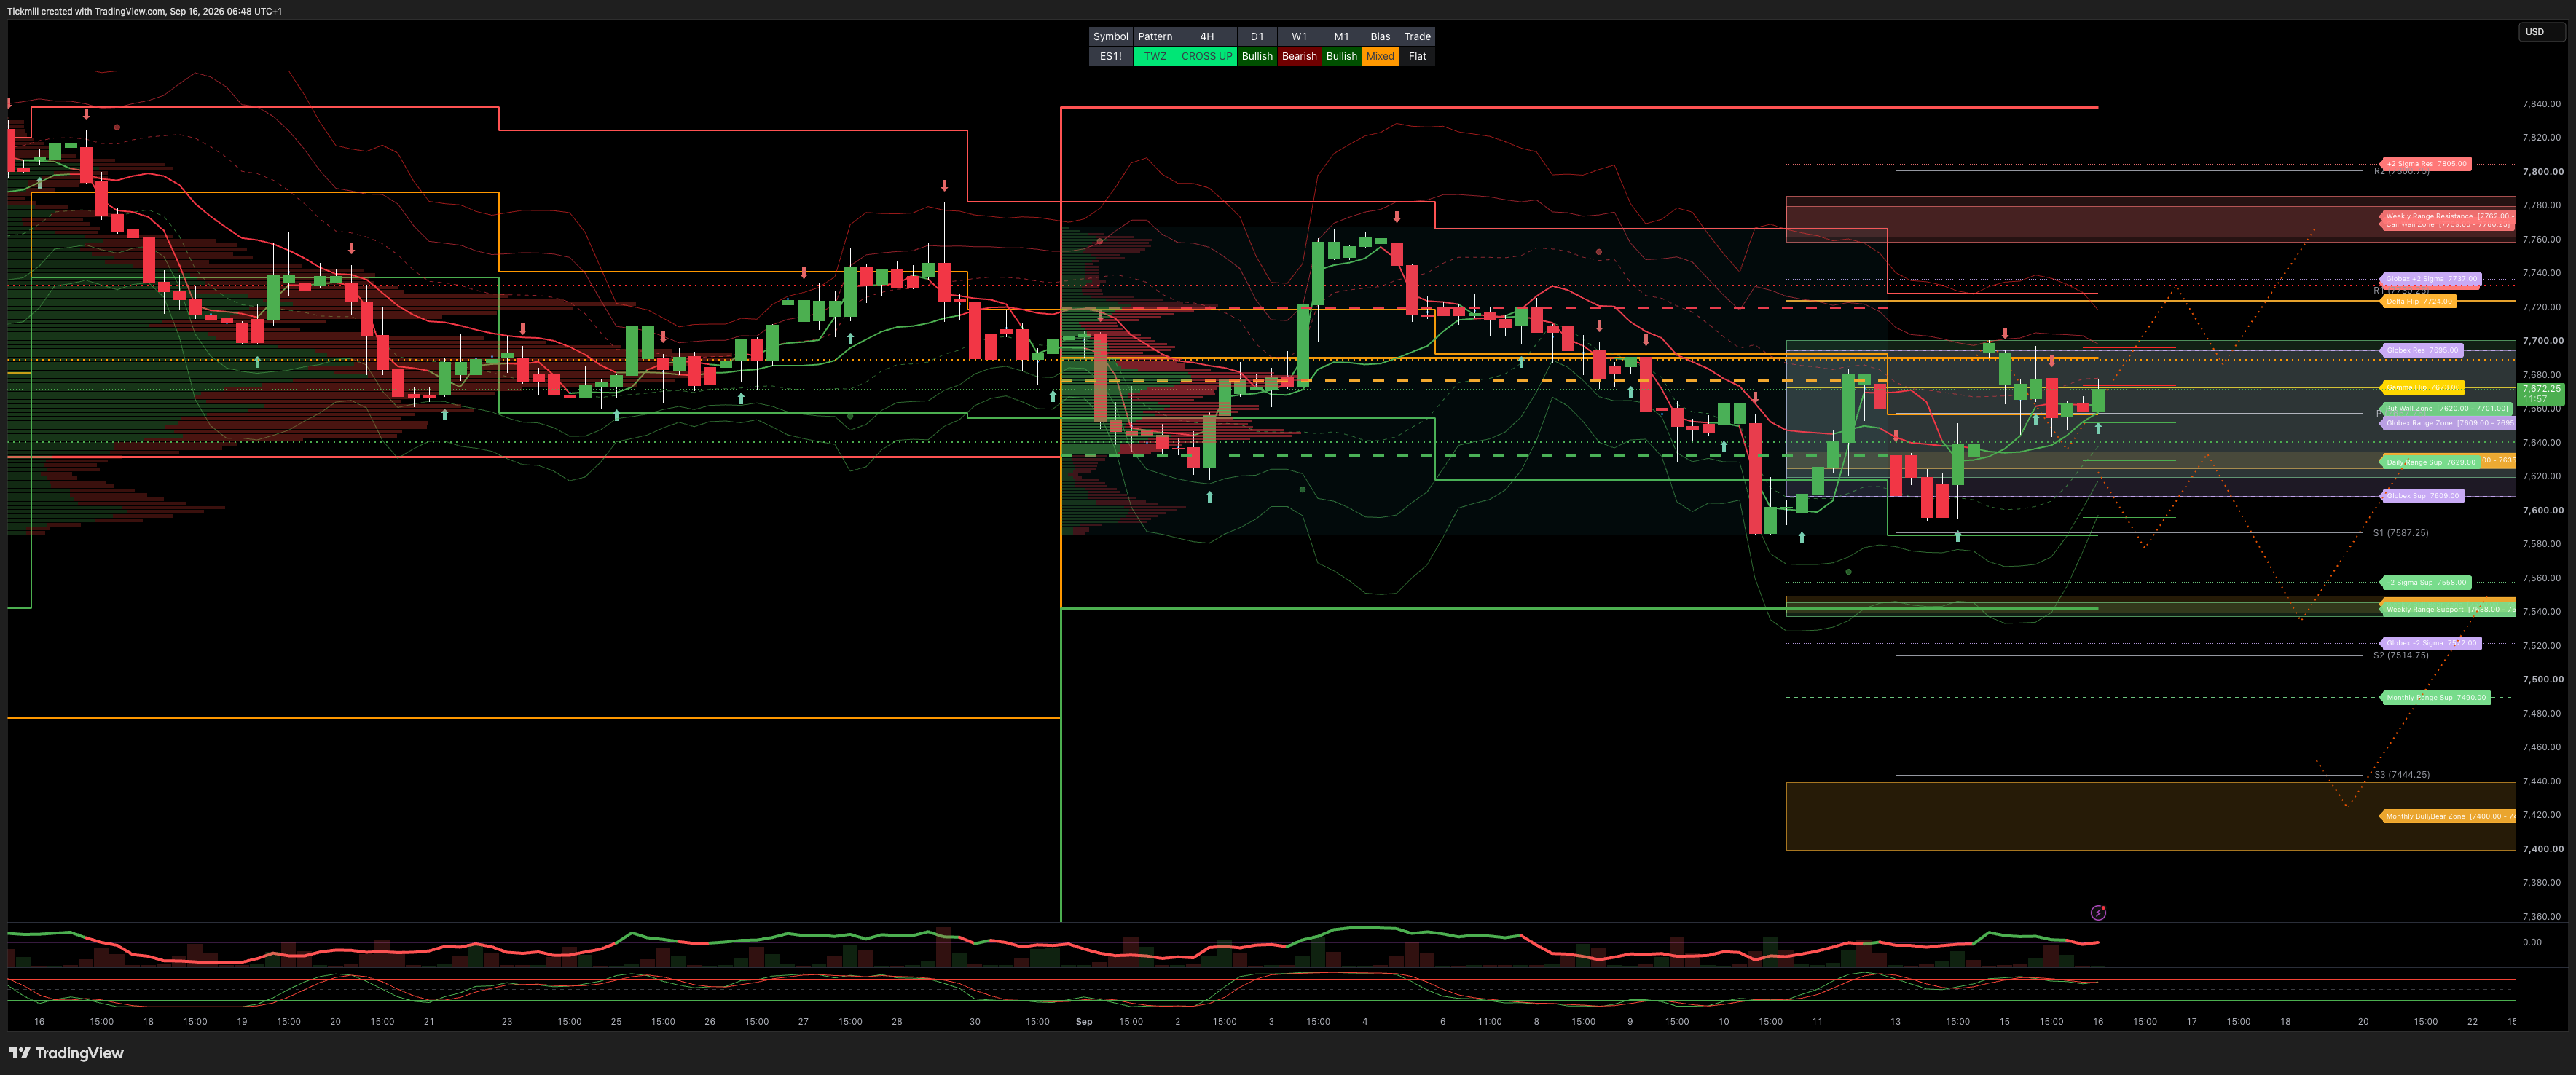
S&P500 Daily Action Areas & Price Targets 16/9/26
***QUOTING ES1!(Z CONTRACT LEVLES) FOR CASH US500 EQUIVALENT LEVELS, SUBTRACT POINT DIFFERENCE***
MONTHLY-WEEKLY& DAILY LEVELS
MONTHLY BULL BEAR ZONE 7440/7400
MONTHLY RANGE RES 7882 SUP 7490
WEEKLY BULL BEAR ZONE 7550/40
WEEKLY RANGE RES 7762/86 SUP 7538/46
DAILY BULL BEAR ZONE 7635/25
DAILY RANGE RES 7735 SUP 7629
2 SIGMA RES 7805 SUP 7558
GLOBEX RANGE SUP 7609 RES 7695
2 SIGMA RANGE SUP 7522 RES 7737
GAMMA FLIP 7673
DELTA FLIP 7724
PUT WALLS 7701/ 7620
CALL WALLS 7759 / 7780.15
UNFILLED GAPS 7620 - 7541
DAILY STRUCTURE - BALANCE - 7719/7585
WEEKLY STRUCTURE - OTFL - 7717
MONTHLY STRUCTURE - OTFH - 7542
VIX BULL BEAR ZONE 17.3 (VVIX / VIX) 5.39 - 5.0–6.0: Normal tension as traders hedge volatility while VIX remains subdued. Near 5 or lower suggests complacency; above 7 signals high fear and aggressive future volatility pricing.
PRIMARY TRADES & TARGETS
LONG ON REJECT/RECLAIM DBBZ TARGET DAILY RANGE RES
LONG ON REJECT/RECLAIM WBBZ TARGET
***ADDITIONAL SETUPS & TARGETS HIGHLIGHTED ON THE CHARTS***
(I FADE TESTS OF 2 SIGMA LEVELS ESPECIALLY INTO THE FINAL HOUR OF THE NY CASH SESSION AS 90% OF THE TIME WHEN TESTED THE MARKET WILL CLOSE ABOVE OR BELOW THESE LEVELS)
SPX PUT/CALL RATIO 1.20 (The numbers reflect options traded during the current session.) A put-call ratio below 0.7 is generally considered bullish, and a put-call ratio above 1.0 is generally considered bearish.
JHEQX Q3 Collar Short Call Cap: ~7,750 – 7,900 - Long Put Strike: ~7,050 – 7,100 (approx. 5% downside protection) Short Put Strike: ~5,950
DEC2025 OPEX to DEC2026 OPEX is 945 points giving us a range of [5889,7779]
Notes On Structure Implications
Balance: This refers to a market condition where prices move within a defined range, reflecting uncertainty as participants await further market-generated information. Our approach to balance includes favouring fade trades at the range extremes (highs/lows) while preparing for potential breakout scenarios if the balance shifts.
One-Time Framing Higher (OTFH): This represents a market trend where each successive bar forms a higher low, signalling a strong and consistent upward movement.
One-Time Framing Lower (OTFL): This describes a market trend where each successive bar forms a lower high, indicating a pronounced and steady downward movement.
GOLDMAN SACHS FICC & EQUITY TRADING DESK VIEWS
THE TAKE: OIL & YIELDS DOMINATE TAPE INTO HIGH-STAKES FED MEETING
US equity benchmarks extended losses for another session as oil and rates continued to dictate macro sentiment ahead of the September 16 FOMC rate decision (2:00 PM ET). Market odds for a 25 bps rate hike sit at >90%, with rates markets now pricing in two full hikes by year-end 2026.
The US 10-Year yield closed above 5.0% (5.0081%), holding levels not seen consistently since 2023. Meanwhile, WTI Crude surged +4.43% to $105.90/bbl, driven by compounding supply disruptions: Saudi Arabia suspending Yanbu shipments and canceling September loadings, ongoing Libyan production halts, and escalating Houthi activity in the Red Sea. Energy equities (GSXUENRG) squeezed +2.7%, exerting severe pressure on consumer discretionary names and broader market breadth (344 S&P 500 constituents closed lower).
MARKET SUMMARY & ASSET BREAKDOWN
S&P 500 (SPX): Closed at 7,585.00 (-0.45%) | VIX up +58 bps to 17.2 | MOC $1.45B to SELL | Weak market breadth with 344 names in the red
Nasdaq-100 (NDX): Closed at 28,937.00 (-0.65%) | Hardware/Semis stabilized following CEO pushback | Megacap tech mostly lower; AMZN down 6 of last 7 sessions
Russell 2000 (RUT): Closed at 2,870.00 (-0.76%) | Multi-session underperformance as rate-sensitive small-caps face 5%+ yields
Dow Jones (DJI): Closed at 52,093.00 (-0.63%) | Dragged down by fuel-sensitive cyclicals and consumer pressure
US 10-Year Treasury: Yield at 5.0081% (+2.1 bps) | Sustained move >5.0% | Yield curve pricing hawkish FOMC & SEP path
WTI Crude: Price at $105.90 (+4.43%) | Breaches $105 on Saudi/Libya/Houthi supply halts | Major inflation friction for central banks
Gold: Price at $4,295.00 (-0.11%) | Holding near $4,300 as DXY firms (+26 bps to 99.65) | Consolidation into rate decision
Bitcoin: Price at $75,806.00 (-4.15%) | Risk-off de-leveraging ahead of Fed | Pulled back alongside high-beta assets
AI CAPEX DEBATE & EXECUTIVE PUSHBACK
Hardware Stabilization: Following the violent rotation out of hardware earlier in the week, the AI trade showed signs of stabilization despite continued de-grossing flows.
CEO Commentary Counter-Narrative:
NVIDIA (NVDA): CEO Jensen Huang directly pushed back against model-pacing concerns, emphasizing that safety and rapid innovation can co-exist without decelerating infrastructure buildouts.
Broadcom (AVGO): CEO similarly downplayed fears that a temporary pause in frontier model scale would impact custom silicon or datacenter semi demand.
Megacap Tech: Mostly lower across the board, with Amazon (AMZN) continuing to lag as a notable underperformer (down in 6 of the last 7 trading sessions).
DESK FLOWS & INSTITUTIONAL POSITIONING
Desk Activity (3/10 Rating): Floor activity remained light heading into the FOMC meeting, finishing -740 bps better for sale.
Asset Managers (Long Onlys): Finished -$454M better for sale, with supply concentrated in macro ETF products and tech, against light buying demand in Communication Services, Financials, and Consumer Discretionary.
Hedge Funds: Finished relatively flat on the day, showing sell supply in Consumer Discretionary and Financials, offset by small net demand in Consumer Staples and macro products.
Disclaimer: The material provided is for information purposes only and should not be considered as investment advice. The views, information, or opinions expressed in the text belong solely to the author, and not to the author’s employer, organization, committee or other group or individual or company.
Past performance is not indicative of future results.
High Risk Warning: CFDs are complex instruments and come with a high risk of losing money rapidly due to leverage. 69% and 73% of retail investor accounts lose money when trading CFDs with Tickmill UK Ltd and Tickmill Europe Ltd respectively. You should consider whether you understand how CFDs work and whether you can afford to take the high risk of losing your money.
Futures and Options: Trading futures and options on margin carries a high degree of risk and may result in losses exceeding your initial investment. These products are not suitable for all investors. Ensure you fully understand the risks and take appropriate care to manage your risk.
Patrick has been involved in the financial markets for well over a decade as a self-educated professional trader and money manager. Flitting between the roles of market commentator, analyst and mentor, Patrick has improved the technical skills and psychological stance of literally hundreds of traders – coaching them to become savvy market operators!